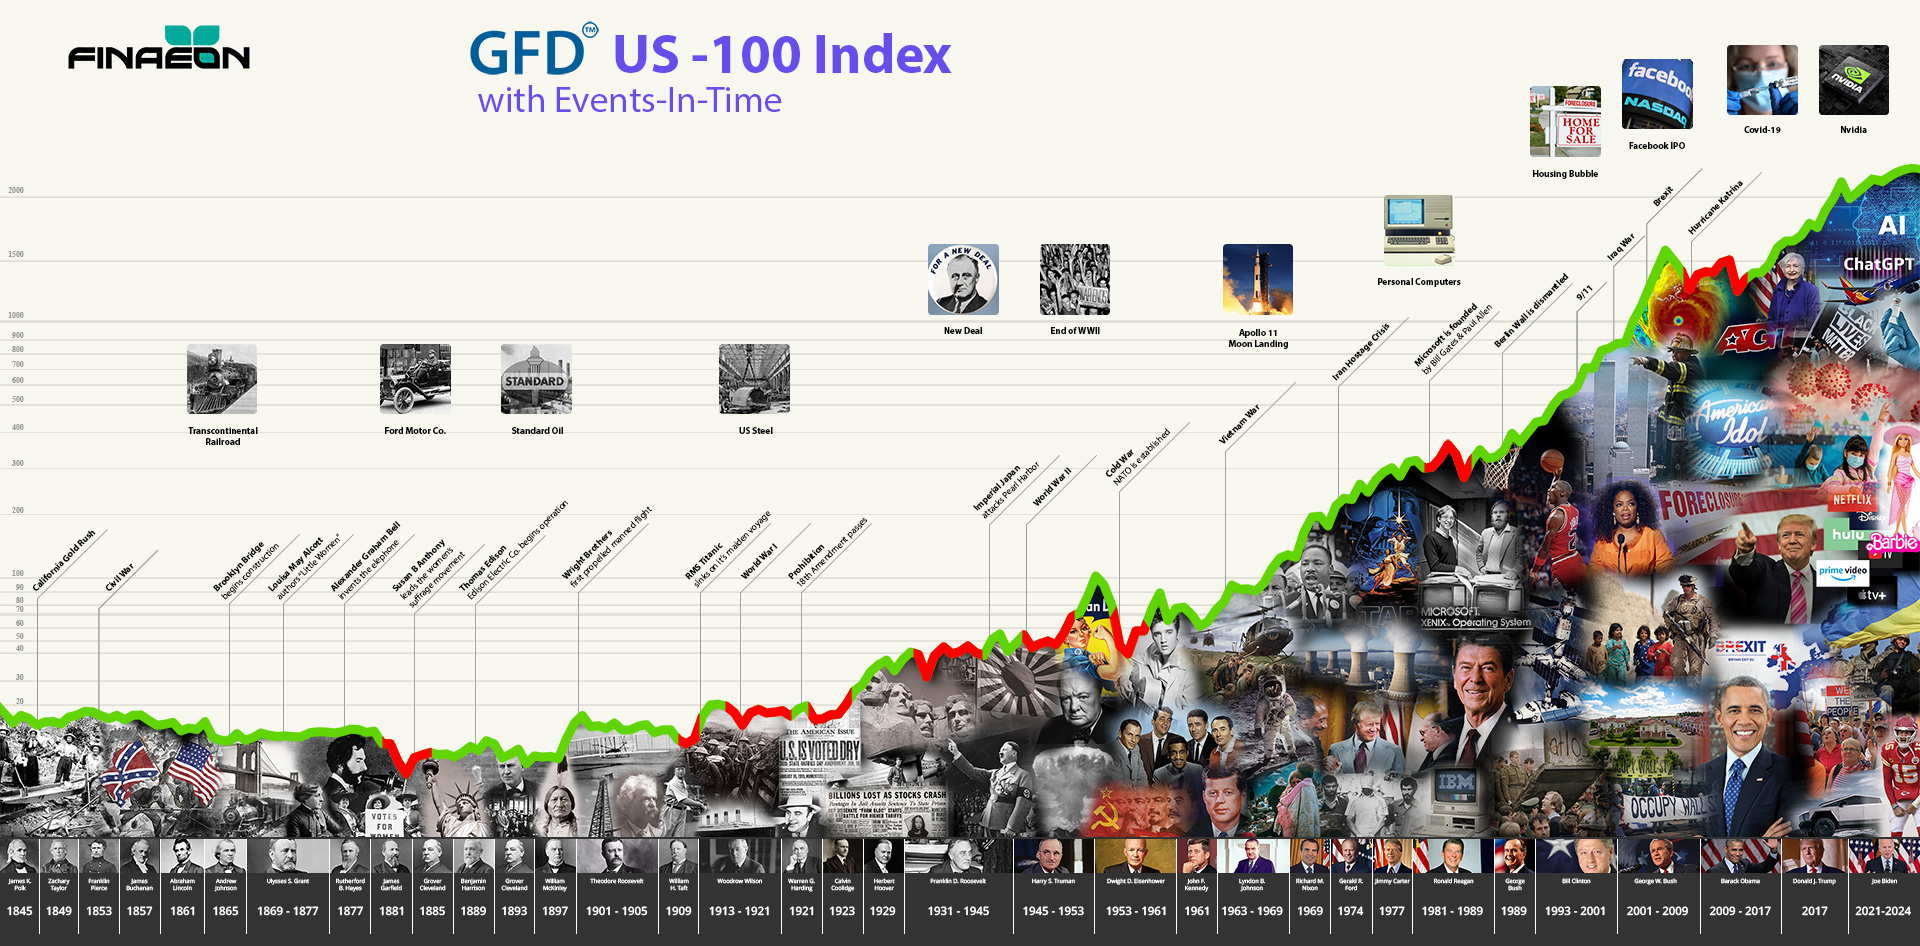
Bryan Taylor, Chief Economist, Finaeon

The U.S. stock market fell into a bear market on March 12, 2020 ending the bull market that began in 2009. The bull market began on March 9, 2009 and peaked on February 19, 2020. During this raging bull, the S&P 500 rose 400% between 2009 and 2020, the Dow Jones Industrials rose 351% between 2009 and 2020 and the NASDAQ Composite 674%!
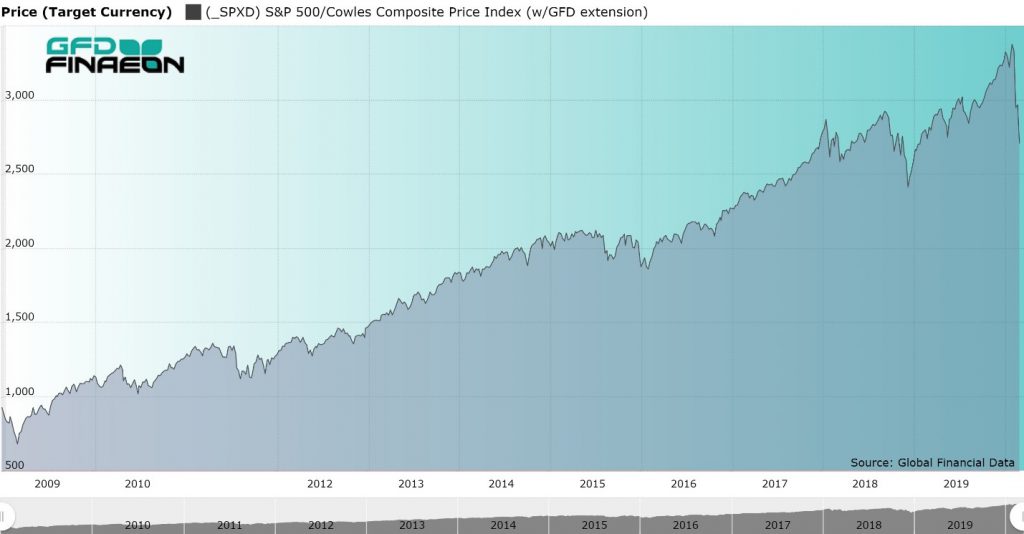
Figure 1. S&P 500, 2009 to 2020
Raging Bull to Roaring Bear
What is interesting about this bear market is how quickly it hit and how sharply markets throughout the world dropped in response to the Coronavirus epidemic. There was no gradual spread of this financial pandemic. It hit all the world’s stock markets severely and simultaneously.
Information of all the bull and bear markets that have affected the American stock market since 1792 and is provided in Table 1. For each market we have provided the date when the bull or bear market hit its top or bottom, the value of the index and the percentage decline in the bear market or percentage rise in the bull market.
Bear Stats are In
By our calculation, there have been twenty-four bull and bear markets since 1792 with four occurring in the 1800s, seventeen in the 1900s and three in the 2000s. The worst decline was the 1929-1932 bear market during which the Dow Jones Industrials declined by 89%. The longest bear market lasted from 1792 until 1843. The strongest bull market occurred between 1974 and 1987 when the market rose by 442%. The two previous bear markets in this century both had declines of 50% in 2000-2002 and 2007-2009.
| Date | Value | Change | Date | Value | Change | Cause |
|---|---|---|---|---|---|---|
| 01/02/1792 | 4.516 | |||||
| 01/31/1843 | 1.497 | -66.85 | 08/31/1853 | 2.584 | 72.61 | Panic of 1837 |
| 10/31/1857 | 1.712 | -33.75 | 07/30/1864 | 4.092 | 139.02 | Panic of 1857 |
| 10/31/1873 | 2.682 | -34.46 | 05/31/1881 | 5.189 | 93.48 | End of Civil War, Panic of 1873 |
| 01/31/1885 | 3.394 | -34.59 | 6/17/1901 | 8.53 | 123.88 | Long Depression |
| 11/9/1903 | 5.85 | -31.42 | 10/9/1906 | 10.23 | 74.87 | Rich Man's Panic |
| 11/15/1907 | 6.10 | -40.37 | 11/19/1909 | 10.6 | 73.77 | San Francisco |
| 10/31/1914 | 6.63 | -37.45 | 11/20/1916 | 10.55 | 59.13 | World War I |
| 12/19/1917 | 6.00 | -43.13 | 7/16/1919 | 9.64 | 60.67 | Fear of Entering War |
| 8/24/1921 | 6.26 | -35.06 | 9/7/1929 | 31.86 | 408.95 | Post-WW I Recession |
| 7/8/1932 | 4.41 | -86.16 | 9/7/1932 | 9.31 | 111.11 | Great Depression |
| 2/27/1933 | 5.53 | -40.60 | 7/18/1933 | 12.2 | 120.61 | Bank Holidays |
| 3/14/1935 | 8.06 | -33.93 | 3/10/1937 | 18.68 | 131.76 | Depression Fears |
| 3/31/1938 | 8.5 | -54.50 | 11/9/1938 | 13.79 | 62.24 | Recession of 1937 |
| 4/28/1942 | 7.47 | -45.83 | 5/29/1946 | 19.25 | 157.70 | World War II approaches |
| 6/13/1949 | 13.55 | -29.61 | 8/2/1956 | 49.75 | 267.16 | Post-WWII Recession |
| 10/22/1957 | 38.98 | -21.65 | 12/12/1961 | 72.64 | 86.35 | Sputnik |
| 6/26/1962 | 52.32 | -27.97 | 2/9/1966 | 94.06 | 79.78 | Steel Strike, Kennedy Panic |
| 10/7/1966 | 73.2 | -22.18 | 1/5/1973 | 119.87 | 63.76 | Viet Nam |
| 10/3/1974 | 62.28 | -48.04 | 8/25/1987 | 337.89 | 442.53 | OPEC Embargo |
| 12/4/1987 | 221.24 | -34.52 | 7/16/1990 | 369.78 | 67.14 | 1987 Crash |
| 10/17/1990 | 294.51 | -20.36 | 3/24/2000 | 1527.46 | 418.64 | Iraq War |
| 10/9/2002 | 776.77 | -49.15 | 10/9/2007 | 1565.15 | 101.49 | Internet Bubble, 9/11 |
| 3/9/2009 | 676.53 | -56.78 | 2/19/2020 | 3386.15 | 400.52 | Financial Recession |
| 3/12/2020 | 2236.70 | -33.95 | Coronavirus |
Table 1. Bear Markets in the United States, 1792 to 2020
The question is, how much more is the stock market likely to fall before we reach a bottom? Will this be a short-lived bear market as occurred in 1987 and 1990 or a more extended bear market as occurred in 2000-2002 and 2007-2009? We certainly hope that the restrictions on travel, reduction in large gatherings, encouragement for social distancing and self-quarantine will be effective in reducing the spread of Covid-19 throughout the United States and the rest of the world so the stock market can regain its losses, build a bottom and begin another bull market. Afterall, who doesn’t love the raging bull?